Our National Time Bomb
A guide to the U.S. fiscal outlook
Though the nation’s financial situation has been in the spotlight for years, recent events have brought a new sense of urgency and alarm. The federal debt, the deficit, spending, taxes—these issues have galvanized the public’s attention and dominated the national debate for months.
In early August, as Virginia Magazine was going to press, Congress passed legislation to raise the federal debt ceiling and trim deficits by at least $2.1 trillion over 10 years.
Peter G. Peterson and the bipartisan foundation he created have been shining a light for years on the fiscal challenges threatening America’s future. In a “citizen’s guide” to the state of the nation’s finances published in April 2010, before the federal debt ceiling became prime-time news, the foundation urged action to address the long-term issues in “our fiscal time bomb.”
Last fall Peterson was awarded a Thomas Jefferson Foundation medal, the University’s highest external honor, for his role in addressing the nation’s fiscal situation. Harry Harding, dean of UVA’s Frank Batten School of Leadership and Public Policy, describes him as a personal hero “because he was so far ahead of his time in focusing on this issue of import today.”
One of Peterson’s rallying cries is for citizens to be informed. To that end, Virginia Magazine tapped various resources, from Peterson’s foundation to University faculty and alumni, to present information about the debt, deficit and other fiscal issues.
What’s red and has 12 zeros?
The U.S. deficit hit $1.3 trillion in fiscal year 2010.
A trillion is a stunning figure—one digit with 12 zeros. It’s so big it dwarfs normal ideas of “big.” English doesn’t have a trillion words (more like 750,000). Earth has only about 344 million cubic miles of water. The farthest galaxy we can see is a mere 11 billion light years away.
Equally daunting as the deficit’s size is its complexity. And in the context of the heated debate playing out on the national stage, it’s important to keep an eye on the basics.
The federal government needs money to operate. Much of that money comes through taxes (some comes from fees, such as those charged at national parks). The government spends that revenue on everything from bullets for Marines to spaceships for astronauts to education for children.
Government expenses are either mandatory or discretionary. Mandatory ones get paid year-in and year-out without Congress’ annual approval. Examples include Social Security (benefits for the retired, unemployed, disabled and survivors), Medicare (health insurance for people over 65 as well as some younger disabled people) and Medicaid (health insurance for the poor).
Unlike mandatory expenses, Congress approves discretionary ones annually. These include costs for defense, foreign relations, air traffic control, education and thousands of other areas.
If taxes don’t cover costs, then the government has a gap—a deficit—between what it takes in and what it spends. The government covers the gap by borrowing, using debt instruments, such as U.S. bonds.
Deficits now are common, but they weren’t always, notes The State of the Union’s Finances, a report by the Peter G. Peterson Foundation.
“Up until the Great Depression in the 1930s, the U.S. experienced more budget surpluses than deficits. Since World War II, we have balanced the federal budget only a dozen times, with only four of those, fiscal years 1998-2001, occurring in the past 40 years. Of the four years when we had surpluses, only in fiscal year 2000 did the federal government have an operating surplus (which excludes consideration of the Social Security surplus). In the past 40 years, deficits as a percentage of the economy have averaged slightly over 3 percent,” the report says.
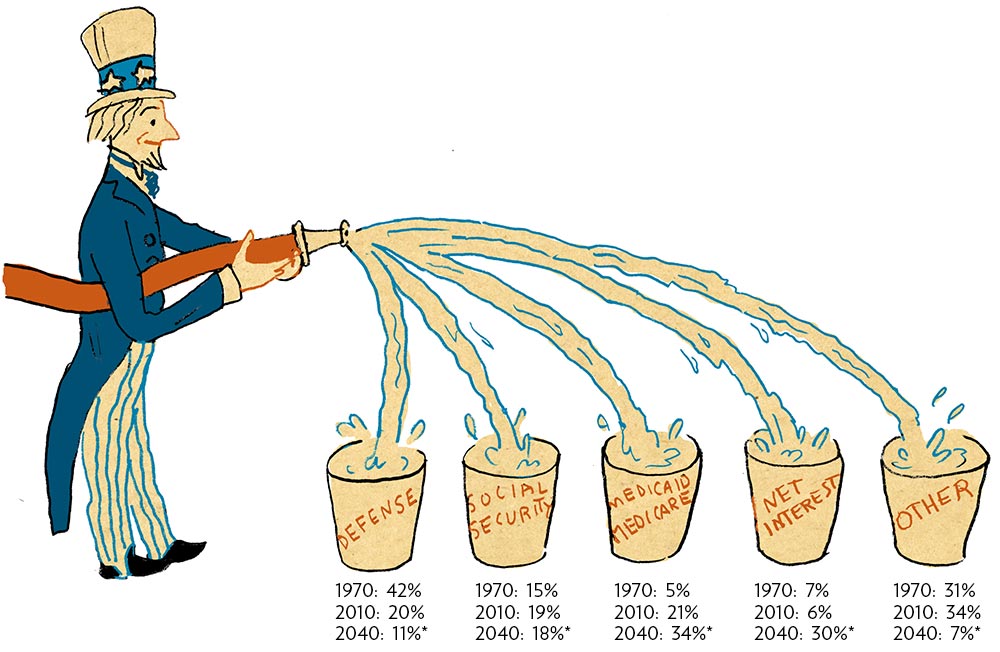
Just as deficits have become more frequent, the way the federal government spends money has changed. Compare 1970, when the U.S. was fighting the Vietnam War, and 2010, with two wars ongoing and a weak economy (see figure 3 below).
Figure 1: Debt as a percentage of Gross Domestic Product

35 PERCENT of GDP: The level of federal debt held by the public over the last 40 years; this was roughly the level that existed at the end of 2007 (about $5 trillion).
62 PERCENT of GDP: The level of federal debt held by the public at the end of 2010, the highest level since shortly after World War II (more than $9 trillion). Sixty percent is an international standard for a debt cap.
303 PERCENT of GDP: The level of federal debt projected by the Peterson Foundation to be held by the public by 2040 if certain policies continue. If certain laws, such as ending some tax cuts, take effect, the CBO projects the debt to be 79 percent by 2035.
Source: Congressional Budget Office
Why so big?
The U.S. government’s deficit in 2010’s budget is gargantuan—$1.3 trillion—but it’s dwarfed by the size of the gross federal debt—more than $14 trillion.
The size of these numbers begs the question “Why are they so big?” Mike Gallmeyer, a professor in the McIntire School, puts it in simple terms: “We’re paying for a lot of things.”
The U.S. is fighting wars in Iraq and Afghanistan. We also are engaged in a Libyan conflict that is anticipated to cost $1.1 billion by September. Spending on Social Security, Medicare and Medicaid, in addition to diminished revenues, feed the picture.
Although the country has run deficits for decades, ones of recent years have increased dramatically. For that, says Darden School professor Alan Beckenstein, we can thank the recent financial crisis. It shocked the economy severely, causing the deepest plunge in U.S. gross domestic product since the Great Depression. (GDP is the total market value of all domestically produced goods and services.)
As Beckenstein notes, business slowed as the economy weakened. People lost jobs; tax revenues shrank at the same time that expenses rose. Determined to prevent an economic free fall, Washington pumped money into failing banks and auto makers, provided stimulus packages and paid benefits to a growing number of unemployed people.
With improvements in the economy, the need for emergency financial programs will wane. But that’s not necessarily the case with big federal budgets, says Frank Warnock, another professor in the Darden School. Under policies existing before the Aug. 2 debt ceiling deal, annual federal spending—already at $3.5 trillion—was projected to almost double over the next 30 years.
“Here’s the truly damning aspect of the fiscal situation. If you project a few years out and keep in mind the spending that’s ‘hardwired’ [mandatory spending], we’ll still be running big deficits. To handle them, we’ll have to borrow money. Certainly, you can borrow in bad times, but you can’t borrow all the time,” he says.
The increase in mandatory expenses—Social Security, Medicare and Medicaid—in particular concerns Warnock and many economists. “It’s a straight line that marches upward,” Warnock says. “It’s all due to the aging of our society and the greater expense of medical procedures. We’re talking about a big chunk of government spending.”
Warnock estimates that Medicare/Medicaid costs now are about 5.5 percent of GDP. With the baby boom generation aging and requiring more health care, this spending could rise to 7 percent of GDP by 2020 and 10 percent by 2030.
Before August, costs of the Social Security Administration were projected to rise by 2035 “so that taxes will be enough to pay for only 75 percent of scheduled benefits,” Stephen C. Goss (Grad ‘73), chief actuary for the Social Security Administration, said in a 2010 analysis. “This increase in cost results from population aging—not because we are living longer, but because birth rates dropped from three to two children per woman. Importantly, this [economic] shortfall is basically stable after 2035.”
Figure 2: Deficit as a percentage of Gross Domestic Product

3 PERCENT of GDP: The average U.S. deficit level over the past 40 years. In 2000, the deficit was 0 percent—the federal government operated with a surplus.
8.9 PERCENT of GDP: The federal deficit at the end of 2010. As a percentage of GDP, it’s the most since the end of WWII; in dollar terms ($1.3 trillion), it’s the largest in U.S. history.
16 PERCENT of GDP: The projected federal deficit in 2035 under one CBO scenario. However, the CBO also said that if certain laws go into effect, the deficit would shrink to 3.1 percent by 2014, then fluctuate between 2.9 percent and 3.4 percent of GDP through 2021.
Source for all figures: Congressional Budget Office
What makes it a crisis?
Spend more than you take in, and you have to borrow. That’s true for governments as well as individuals.
The U.S. has done this for years. Now, we owe creditors roughly $14 trillion. That’s a record. It’s also a problem, says Alan Beckenstein.
“The legacy of debt is a ticking time bomb,” he says.
Darden colleague Frank Warnock agrees. “Debt is the issue,” he says. “Borrowing is not necessarily bad, but persistent borrowing is a problem.”
Though the financial pattern has gone through cycles, the U.S. government typically has spent more than it has brought in for decades, creating deficits funded by loans. The U.S. deficit in 2010 was just under 9 percent of GDP; the federal debt held by the public was 62 percent. International standards call for deficit levels limited to 3 percent and public debt levels at 60 percent of GDP to avoid threatening economic growth.
Piling up big debt can hurt a nation. Paying the loans, for example, is a burden for future generations, Warnock says. The Peterson Foundation projected that spending on net interest would grow from 1 percent of GDP in 2010 to 14 percent in 2040, under pre-August policies. “Servicing that debt would absorb increasing shares of the national income, diverting resources away from productive investments that would create jobs and economic growth, like education, research and development, and infrastructure,” Peterson says.
Beckenstein also notes that a deeply indebted United States may not have the means or flexibility to cope with future emergencies—economic or otherwise.
The McIntire School’s Mike Gallmeyer sees other risks. For example, the U.S. government may need to borrow so much that businesses are squeezed out of the bond market. As a result, companies might not get funds for new technologies or facilities, and be unable to expand and create new jobs, products and services. A heavily indebted U.S. also may find that creditors stop buying our securities out of fear the government can’t pay. Interest payments also could divert cash that otherwise would be used for roads, education and research.
While the situation is serious, history shows it can be fixed. America did deal successfully with its World War II debt. “Other countries, including several in Latin America during the 1980s, have faced similar problems and were forced to make sharp, painful budget adjustments,” Peterson says.
The greatest obstacle to a solution lies in what Beckenstein calls “political asymmetry.” In brief, voters love government services but hate paying taxes. Thus, cutting the former and raising the latter, which is a logical response to the situation, is a tough sell.
Things might be easier, Warnock suggests, if we choose our national priorities wisely, then develop a disciplined spending plan that backs them. The last-minute negotiations that preceded the Aug. 2 debt ceiling deal raised concerns about a U.S. default at a time when other nations are struggling economically.
“Countries like Hungary, Greece and Ireland have faced problems selling their debt,” Peterson says. Because the dollar is a reserve currency (it is used and held in large quantities by countries around the world) and the U.S. economy is still viewed as sound, the U.S. is unlikely to share a similar fate. “However, without warning, international investors could become spooked,” Peterson says. “The consequences—a sharp spike in interest rates—would be devastating to the economy, especially during the current, weak recovery.”
What’s on the table?
A new law and numerous studies address the nation’s fiscal situation. Here is a short guide:
The Debt Deal
In early August, just hours before the nation risked the possibility of default, Congress approved and President Obama signed legislation to cut federal spending over 10 years, create a Congressional Joint Select Committee on Deficit Reduction and raise the debt ceiling.
According to the nonpartisan Congressional Budget Office, “the deficit reduction stemming from this legislation would total at least $2.1 trillion over the 2012-2021 period” (relative to a baseline projection made in March). The joint committee is charged with achieving part of that—at least $1.5 trillion—in budgetary savings over 10 years; automatic reductions, or “triggers,” are in place to require spending caps if the committee does not meet its goals.
While the legislation was hailed as a positive step toward averting financial crisis by some economists and pundits, others were less sanguine. “The Congressional action did nothing but (a) avoided a crisis of their creation and (b) put a Band-Aid on the problem. It was all very superficial,” says Darden professor Frank Warnock.
View the CBO analysis at www.cbo.gov.
Peterson Foundation
Through numerous reports, a documentary film and other initiatives, the foundation has suggested addressing budget controls, making Social Security changes, reducing the rate of growth in health care costs, increasing federal revenues and simplifying the tax code. See details at www.pgpf.org.
“As the president’s fiscal commission and other groups that have produced deficit reduction plans of their own have made clear, the solution to our long-term fiscal challenges will have to involve a mix of both spending cuts and revenue increases,” says Diane Lim Rogers (Grad ‘91). A veteran economist and tax analyst who has worked in various administrations, in academia and with nonpartisan think tanks, Rogers writes a blog, www.economistmom.com.
The National Commission on Fiscal Responsibility and Reform
Established by President Obama and leaders of both parties in Congress, the commission proposed to reduce the deficit to 2.3 percent of GDP by 2015. View the report.
FY 2012 budget resolutions
President Obama and the House Budget Committee presented resolutions about the fiscal year 2012 budget. View them at:
Do politicians ‘get it’?
Just as it has touched nearly every aspect of life in the U.S., the nation’s financial situation has had a profound effect on the political landscape.
The policy origins of the Tea Party, for example, can be found in the crisis, says politics professor Larry Sabato (Col ‘74), founder of the Center for Politics at UVA.
“Other than jobs and the economy, nothing registers more prominently with the public now than the deficit and the debt,” Sabato says. “People look at the accumulated national debt of $14 trillion and their eyes pop. Both parties now acknowledge the need to get the debt under control.”
The Center for Politics held a forum on the federal debt and deficit this spring. Leaders like former U.S. Sen. Alan Simpson of Wyoming gathered at the University to discuss health care, the nation’s debt limit, tax cuts and other facets of the issue.
While debate in Washington has been heated and largely partisan, Sabato has long predicted public pressure would force action. “This may surprise cynics, but ‘we the people’ still run things in the U.S. Most politicians want to get elected and re-elected.” In early August, Congress passed a last-minute debt-ceiling deal, though only after extended, acrimonious confrontations.
Agreement on how to balance the books, however, eludes officeholders. “Republicans want all the savings to come from spending cuts, while Democrats prefer a combination of spending cuts and tax increases,” Sabato says. “Emboldened by the Tea Party, the Republicans who run the U.S. House of Representatives forced a no-new-revenues deal to raise the debt ceiling on a reluctant President Obama and a Democratic U.S. Senate. The battle is far from over, though. A special committee of Congress will report in November about the next round of debt reduction, and the 2012 election results will determine the path forward.
“Given the continuing unhappy state of the economy, plus the influence of the Tea Party in GOP politics, the deficit is guaranteed to be a major issue in 2012. Even if the economy picks up by then, a national debt that will be around $16 trillion at election time ensures the salience of this issue.”
Sabato sees something else at work, too. “Political leaders on both sides will tell you privately that they finally ‘get it,’ that they realize the medium-term and long-term dangers of unbridled debt are so great that they have to find a way to handle the problem.
“I’m never absolutely certain of anything,” Sabato says, “but there’s reason to believe the political system will find a way to ensure some sound economic fundamentals for younger generations.”
What Lessons Are We Learning?
During the last several years, faculty and students at UVA have paid close attention to the nation’s economic downturn, examining the root causes of the recession and incorporating the growing debt and deficit into their analysis of current events.
For example, two students majoring in economics put together an interdisciplinary course in 2009 called “Anatomy of a Financial Crisis.” They geared it to non-economics majors without a background in finance, and the response was overwhelming.
“We had a wait list of 100, but they limited it to 35 to ensure a discussion atmosphere,” says economics professor Charles Holt, who was the faculty sponsor for the class.
The organizers,Vadim Elenev (Col class of ’09) and Grace Ng (Col class of ’09), who were also student instructors for the course, focused on readings and exercises to make students more financially literate.
“Vadim and Grace had worked on Wall Street [during summer internships], and this allowed them to add a lot of perspective,” Holt says.
William Johnson, also an economics professor, found a “teachable moment” with undergrads in analyzing changes in the labor force, employment and unemployment. “The dramatic changes in 2008 made an especially vivid illustration of the relations between these basic concepts in labor economics,” he says.
At the McIntire School, the deficit also has found its way into professor Mike Gallmeyer’s “Advanced Investments” course, which focuses on bonds and derivatives. In learning how to value securities and manage credit risks, students must take into account the United States’ deficit. Gallmeyer says he hopes the course gives students a context for thinking about investments in the “real world” after graduation.
Because deficit and debt developments have been unfolding rapidly, little relevant information is available in textbooks. So Gallmeyer turns to recent academic papers and articles from the financial press for material.
Not surprisingly, the debt and deficit also are factors in case studies used by graduate business students at the Darden School. And the Darden School recently combined with the Batten School of Leadership and Public Policy to create a dual master’s degree program in public policy and business administration.